Data and decisions · Field guide
Show the ___
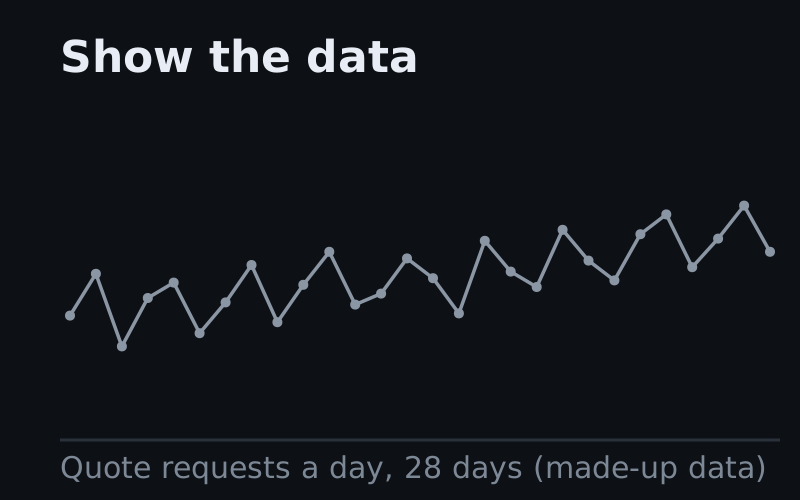
A chart can be correct in every number and still leave the reader asking what the point is. This page draws 29 charts twice from the same data. The first version shows the data. The second version makes one move, such as sorting, adding a target line or splitting a total, and the story becomes visible. The format comes from the data storyteller Chartosaur, credited at the end.
Guess first
Is the support team drowning?
A service director puts this chart in the budget pack and says the support team is drowning, because calls are up by a third in four years. Customers grew from 40,000 to 64,000 over the same four years. Which one move would test the director’s claim?
Tap an answer
The model
Same data, one move
Every pair on this page follows the same three rules, taken from Chartosaur’s carousel and the brief written from that carousel.
- The left panel is fair. The left panel is the chart as most people would draw the chart, plain and correct. A left panel drawn badly on purpose would prove nothing.
- The data does not change. Both panels use the same values, and the same scale wherever the move keeps the unit. When a move changes the unit, for example to a rate or a running total, the right panel says so.
- The right panel makes one move and labels the move. The target, the gap or the outage carries its number in words, so a reader who cannot tell red from green still gets the point.
Before you ask for a chart, finish the sentence “Show the ___”. The word you choose is the question the chart answers.
The 29 moves fall into six families, one for each question a reader brings to a chart. The four with a blue outline are Chartosaur’s originals.
Every number on this page is made up to illustrate the move, and none of the numbers describe a real company.
Family 1 · Time
Which way is it heading?
A line over time gives every wiggle the same weight, so the eye follows the noise. Each move in this family draws something the reader would otherwise have to work out in their head: an average, last year, the seasonal shape, the busiest hour or the point where the actual numbers end.
Family 2 · Against a line
Is that good or bad?
A number means little until the number sits beside something else: a target, a limit, a competitor or last year’s figure. These moves draw that reference on the chart and label each value by its distance from the reference, so the reader judges the result instead of estimating it.
Family 3 · Fair comparison
Are you comparing the right thing?
Counts grow when the business grows, and an alphabetical order or a mean can hide the comparison that matters. These moves change what is counted or how it is ordered. Three of the five moves change the unit, so the right panel has a different axis from the left, and the panel title says which unit the panel uses.
Family 4 · Parts and wholes
What is it made of?
A total hides its parts, and a list of parts hides the total. These moves split a total into its pieces or add pieces into a total. The pairs use bars instead of pies because people judge position along a shared scale more accurately than angles or areas (Cleveland and McGill, 1984).
Family 5 · Paths and places
Where do things go?
A process, the path a customer takes and a country all have a shape that a list of numbers flattens. These moves put the shape back: the order of the steps, the links between where people start and where they finish, or the position on a map. The reader can then point to where the loss or the cluster is.
Family 6 · Honesty
What can the data not tell you?
Some moves add what the data cannot say on its own: a gap in recording, a point that does not belong, the spread behind an average or the range around an estimate. These moves make a chart look less tidy and make the chart more truthful.
Read with care
When the move turns into spin
Each move above chooses what the reader sees first, and the same choice can be used to mislead. These six checks are our own, drawn from the pairs on this page.
- A baseline picked because it flatters. Choose the comparison before you see the result, and say why you compared with last year and not with two years ago.
- Smoothing that hides a point that matters. Say how many days the average covers, and keep the raw points in grey, as the trend pair does.
- A target drawn after the result. Use the target that was set before the period began.
- A rate that hides a total someone has to pay for. Calls per customer answer a question about service, but the budget pays for total calls. If both decisions are on the table, show both charts.
- A map of where people live. Map a rate, such as claims per 10,000 policies, or the darkest areas will be the areas with the most customers.
- Colour without a number. Every story on this page carries its value in words, because colour alone fails readers with colour blindness and fails on a black-and-white printout.
Your chart
Fill in the blank for your next chart
Pick the question your reader brings, pick the move, and describe your data. The page writes a brief you can paste into Claude or another AI tool. The brief asks for both panels, so you can check that the move did not change the data.
Your brief
Your answers stay in this browser. The brief is adapted from the builder prompt written from Chartosaur’s carousel.
Use it this week
Finish the sentence before the next chart
Take one chart from your next report or board pack. Write “Show the ___” above the chart and fill in the blank in one word. If no word fits, the chart is still showing the data, and the move from the matching family is the change to ask for.
The data stays the same, and one move decides whether the reader sees the story.
Turning data into a clear message is one part of digital intelligence, and the 30-day course builds the rest of that skill one day at a time.
Sources
- The format, the titles “Show the data” and “Show the ___”, and four of the moves (seasons, reason, span and point) come from a four-slide carousel by the data storyteller Chartosaur (@chartosaur) on Instagram (post Dfug_l9IBsi, November 2026). The charts on this page are redrawn with our own made-up data, not copied from the carousel.
- The other 25 moves extend Chartosaur’s format. The datasets, the scenes, the family groupings, the checks in “Read with care” and the brief are our own.
- William S. Cleveland and Robert McGill, “Graphical Perception: Theory, Experimentation, and Application to the Development of Graphical Methods”, Journal of the American Statistical Association, 1984. Source of the finding that people judge position along a shared scale more accurately than angle or area.
- The 95% ranges in the uncertainty pair use the usual approximation for a share from a simple random sample: the share plus or minus 1.96 times the square root of share × (1 − share) ÷ sample size.